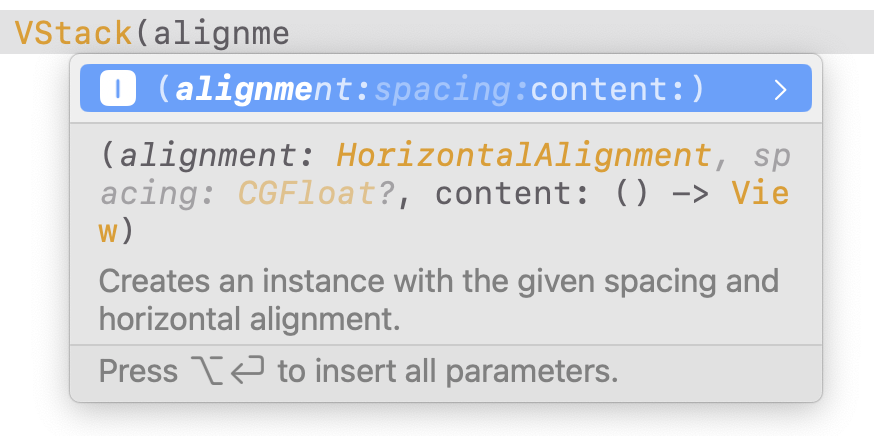
One of the most annoying SwiftUI code completions must be this;
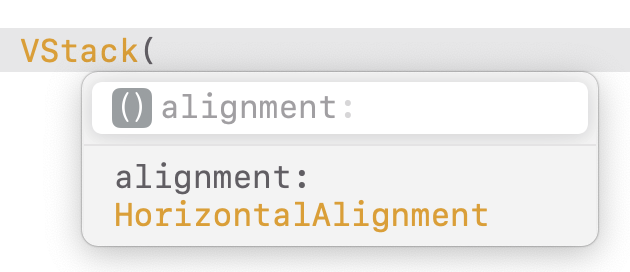
Good news, Xcode 16 has fixed this;
Happy Xcoding!
One of the most annoying SwiftUI code completions must be this;

Good news, Xcode 16 has fixed this;

Happy Xcoding!
When developing applications, encountering crashes is an inevitable part of the process. However, analyzing crash logs can provide invaluable insights into what went wrong, helping developers fix bugs and improve app stability. This blog post will explore how to access crash logs in Xcode and the process of symbolication, which transforms unreadable crash reports into meaningful information.
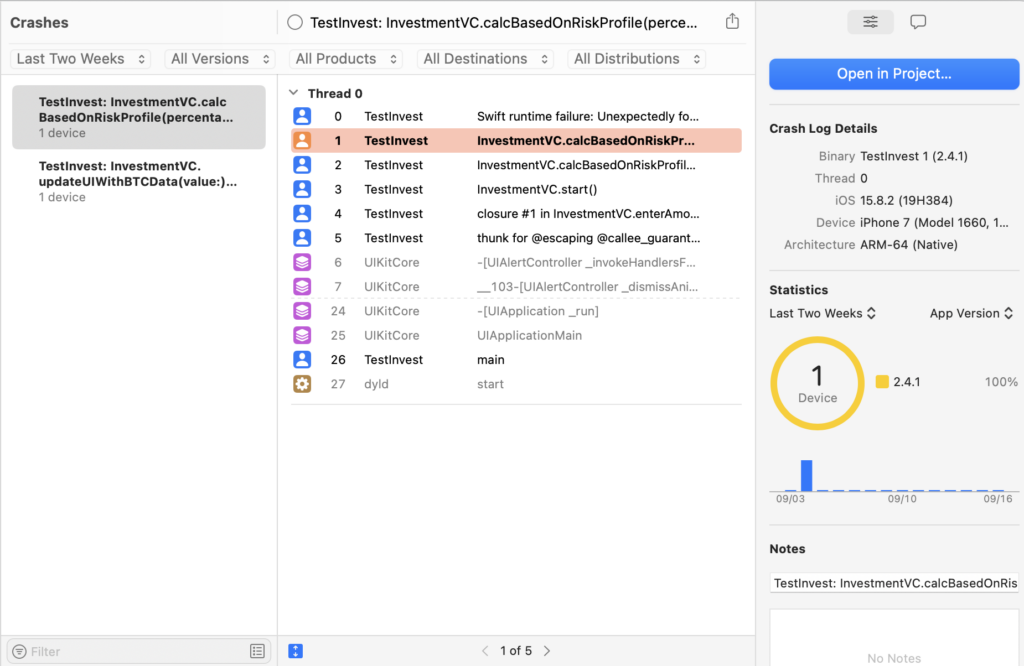
Crash logs are automatically generated when an app crashes on a user’s device. If users have opted to share crash data, these logs can be accessed through Xcode. Here’s how you can find and review these logs:
For more granular analysis, you can export crash reports directly from devices or through the Console app for Mac applications. This allows you to troubleshoot individual incidents that may not be reflected in aggregated data.
A typical crash log contains several key pieces of information:
However, these logs are often presented in a raw format that includes memory addresses instead of function names, making them difficult to interpret without additional processing.
Symbolication is the process of converting these raw memory addresses into human-readable function names, file names, and line numbers. This is crucial for diagnosing crashes effectively.
atos -o /path/to/your/app.dSYM/Contents/Resources/DWARF/YourApp -arch arm64 -l <load_address> <address>

Replace <load_address> and <address> with values from your crash log.Understanding and managing crash logs is a vital skill for any iOS developer. By effectively accessing and symbolizing these logs in Xcode, developers can gain critical insights into their applications’ performance and stability. This not only helps in resolving issues but also enhances user experience by ensuring that apps run smoothly. With regular practice and familiarity with these tools, developers can significantly improve their debugging processes and overall application quality.
Mastering Xcode Debugging with LLDB: A Step-by-Step Guide to Changing Variables at Breakpoints
In the realm of iOS and macOS development, Xcode stands as the primary Integrated Development Environment (IDE), offering powerful tools for developers, including the LLDB debugger. LLDB, or LLVM Debugger, is a powerful successor to GDB, providing advanced debugging capabilities right within Xcode. One of the lesser-known but incredibly useful features of LLDB is the ability to modify variable values directly during a debugging session. Here’s a comprehensive guide on how to leverage this feature to enhance your debugging workflow.
LLDB is more than just a debugger; it’s an interactive environment where you can inspect and manipulate your program’s state. When your app hits a breakpoint, you’re not just pausing execution; you’re entering a session where you can query, modify, and even execute code within the context of your app’s current state.
Once your app hits the breakpoint, follow these steps:
View > Debug Area > Activate Console or use the shortcut (Cmd + Shift + Y).frame variable in the console to list variables in the current scope.myVariable to 10, simply type:expr myVariable = 10expr counter++frame variable again or by hovering over the variable in your code if you’ve enabled variable watching.Imagine you’re debugging a function that calculates the factorial of a number, and you want to see how changing the input affects the result:
func factorial(_ n: Int) -> Int {
    if n <= 1 {
        return 1
    } else {
        return n * factorial(n - 1)
    }
}factorial function.n: expr n = 5help in the console to discover more commands.Mastering LLDB within Xcode can significantly boost your productivity as a developer. The ability to alter variable values at runtime not only aids in debugging but also in understanding the flow and impact of your code in real-time. This technique is particularly useful for experimenting with different scenarios without needing to recompile or rerun your application. Remember, effective debugging is about exploring, understanding, and sometimes, creatively manipulating your code’s environment to uncover issues or test hypotheses. Happy debugging!
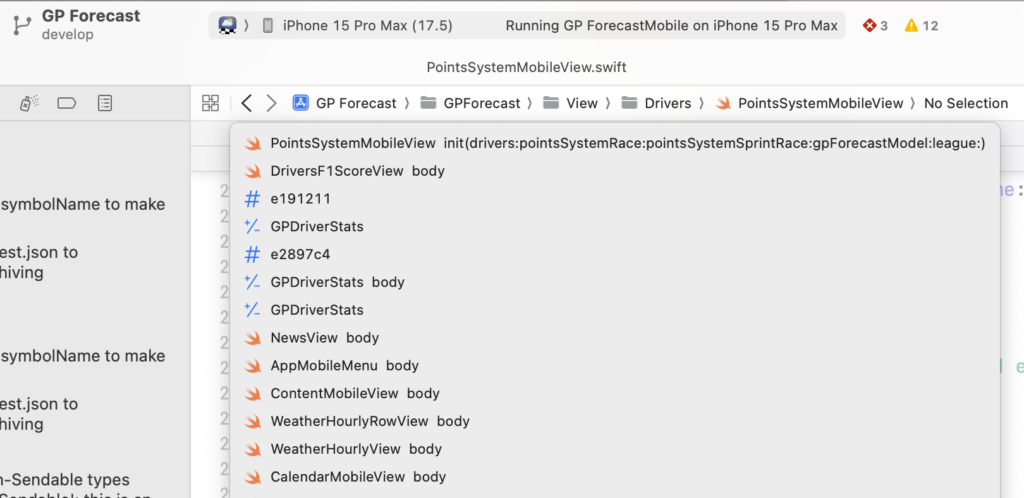
In Xcode in the editor window you can use CONTROL+CMD+ Arrow left/right, to go forward and backwards in files which you have had in your editor. This is really nice and effective to go one or two files back. But if you want to go back many files you can tap and hold on the < and > buttons to reveal the complete history.
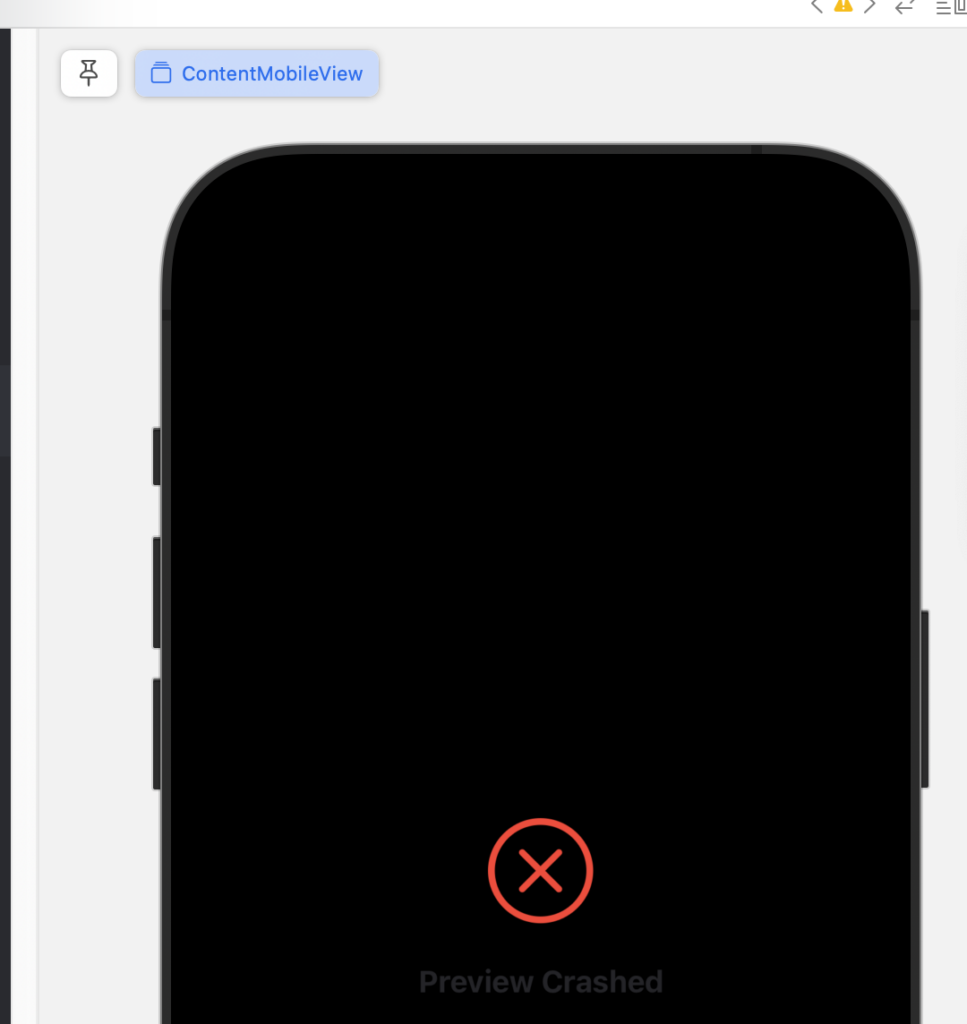
Loved by some, hated by many developers — is the SwiftUI preview. I was also in the latter camp to be honest, until recently.
Here are some things you can do to enjoy your SwiftUI previews again.
When you get an error, tap on the error and read it carefully, often it gives a hint. For example, you have been changing code left and right, then you went to this certain view, and you activated the preview pane with Option+Command+Enter — and getting an error.
Make sure before activating a preview canvas, that your code builds and if not, then fix the error and try again.
If you have done this and you still get an error, make sure you don’t have another tab open with a preview active for another target, close those and try again.
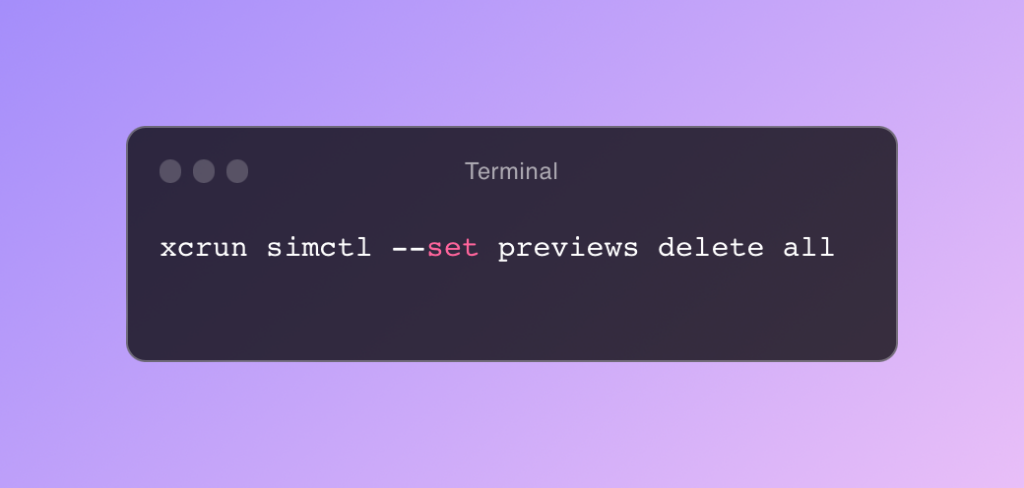
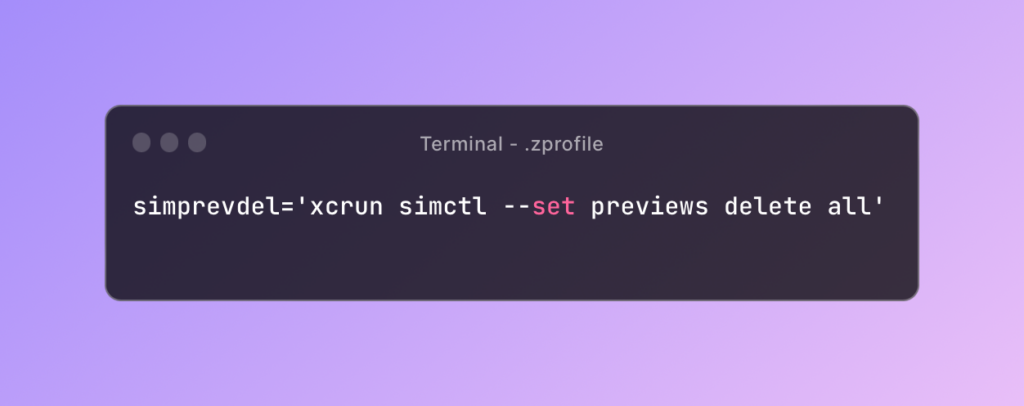
If that also fails you can try to clear the preview cache with this terminal command, I made an alias in .zprofile called simprevdel.
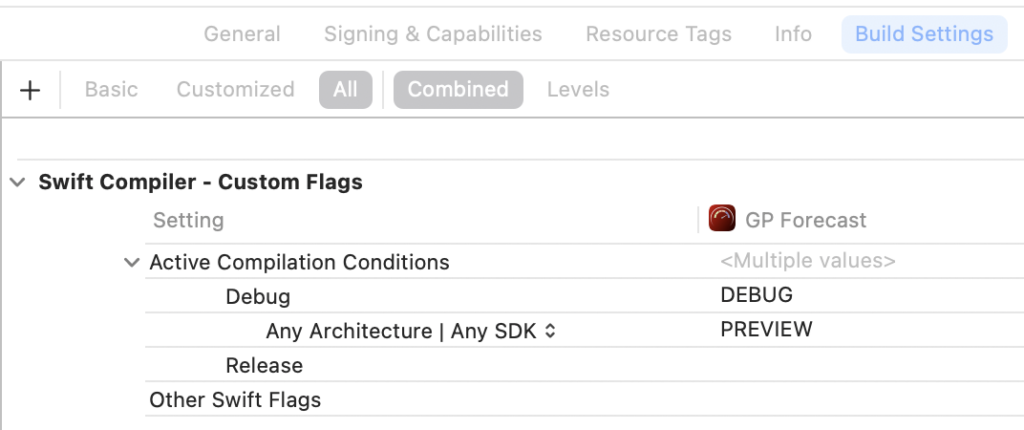
You can add the PREVIEW compiler flag to use it as a compiler directive to load preview mock data.
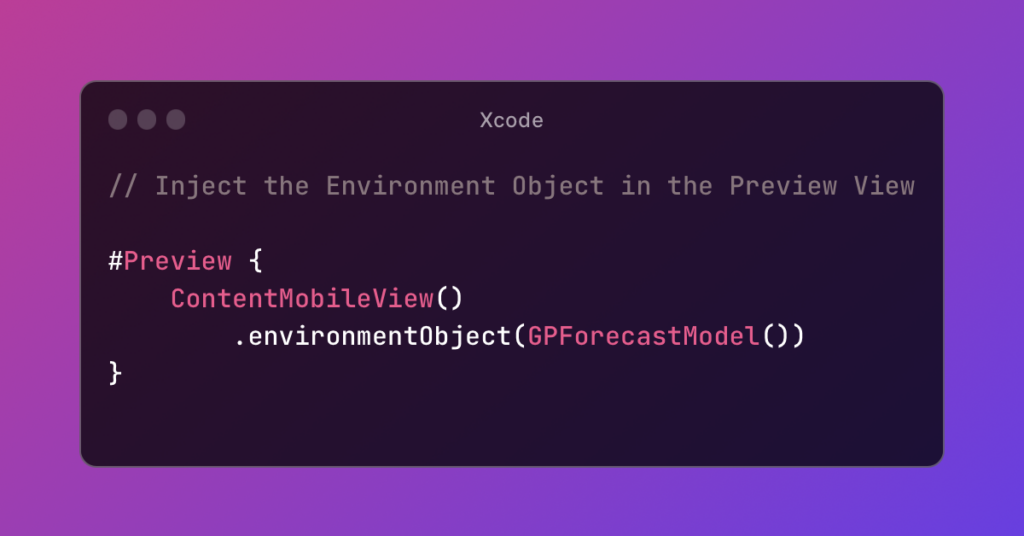
Don’t forget to inject the EnvironmentObject model in the Preview View.
Enjoy your previews!
As developers, we start and switch a lot between common developer applications each day. You can buy some external hardware keyboards to achieve this, like for example with these USB Mini 3-Key Keypad, or the HUION Keydial, 9-Keys USB Mini Keypad, Programming Macro Pad. They work fine but you must always pack them in your bag when going to your workspace, but make sure before purchasing them, that they have macOS software drivers.



Personally I have the Huion, and use it for general Xcode keyboard shortcuts — like show / hide panes, delete current line, Run, Stop, etc, and to save keys I use macOS Shortcuts to launch applications like Xcode.
To achieve this do the following:
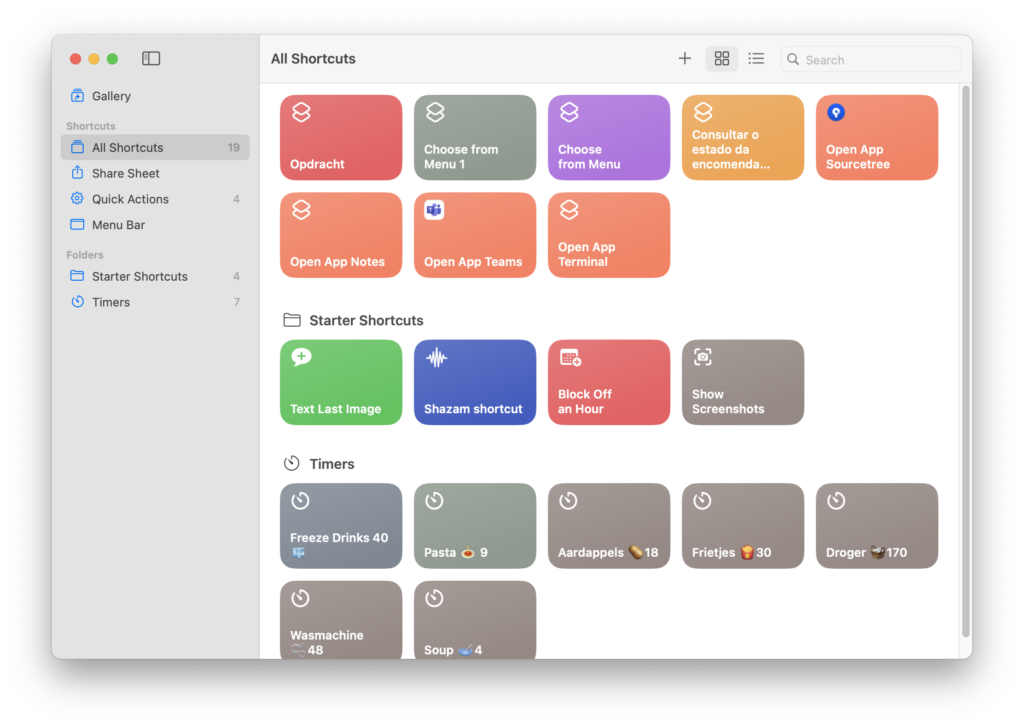
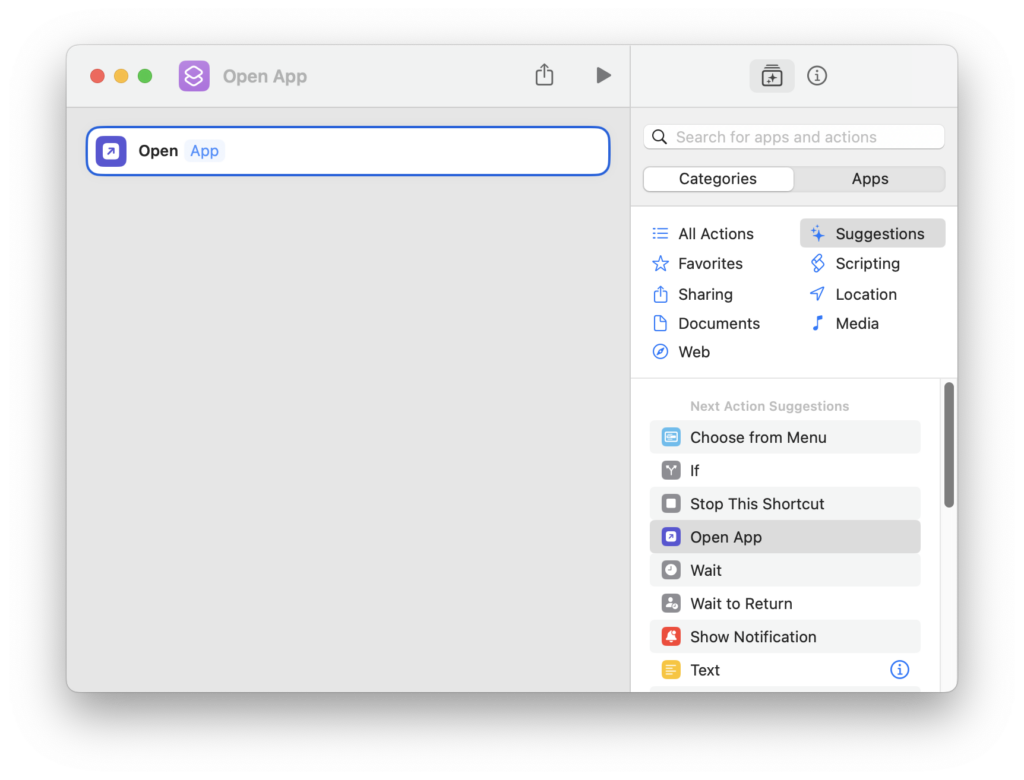
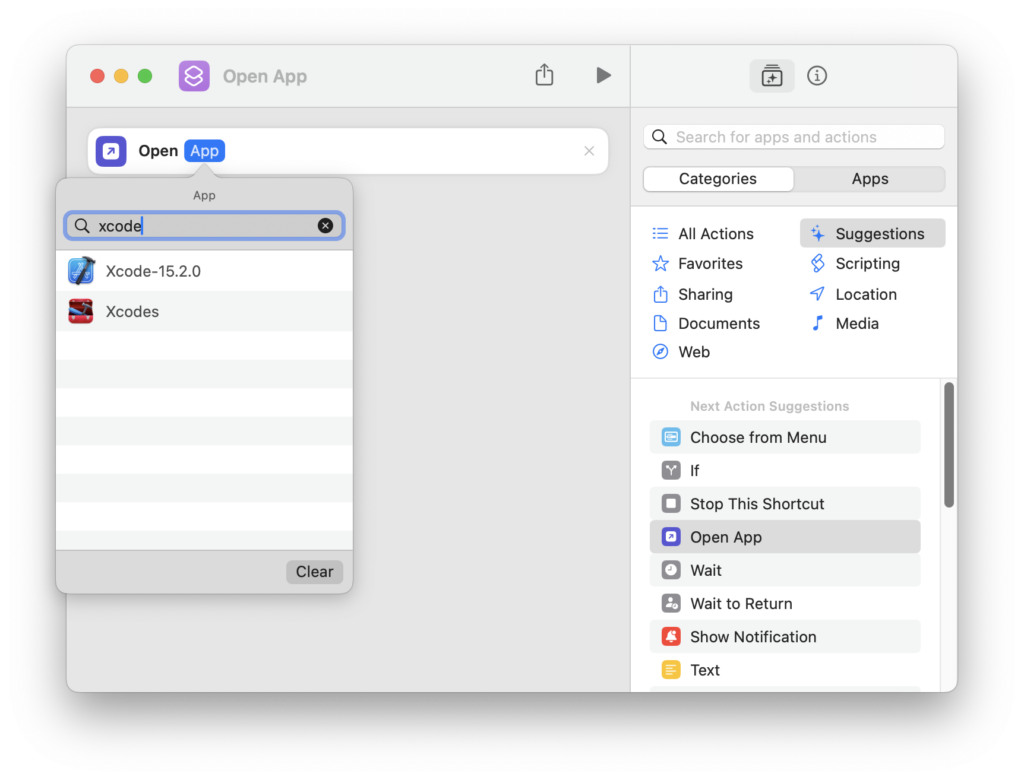
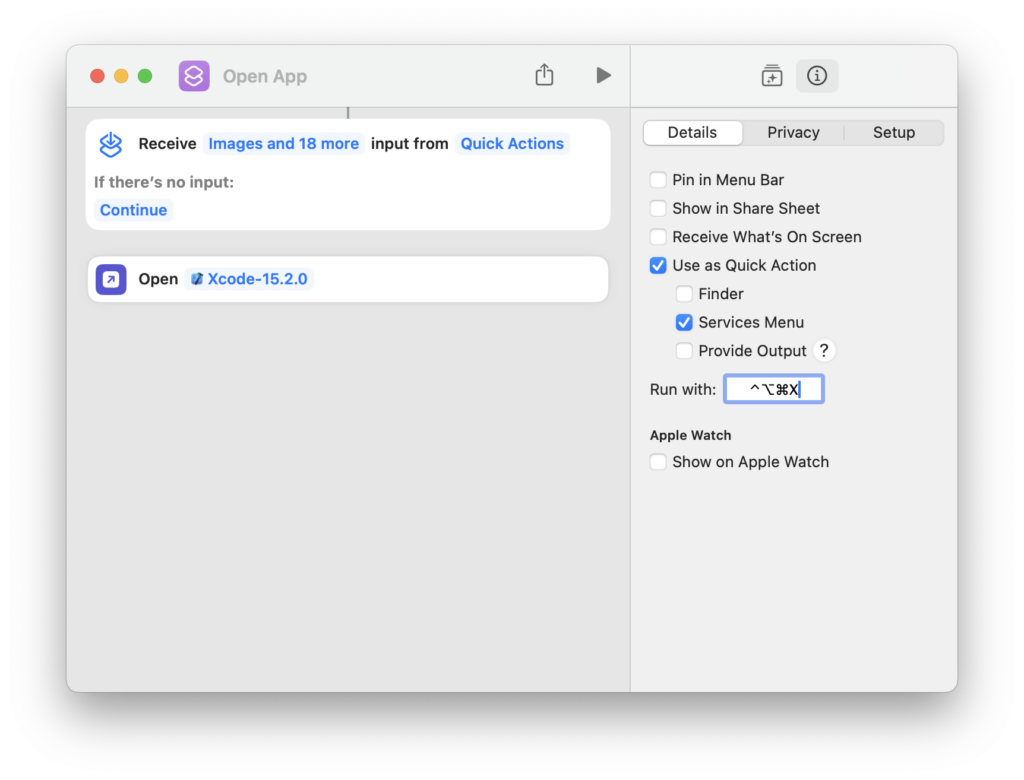
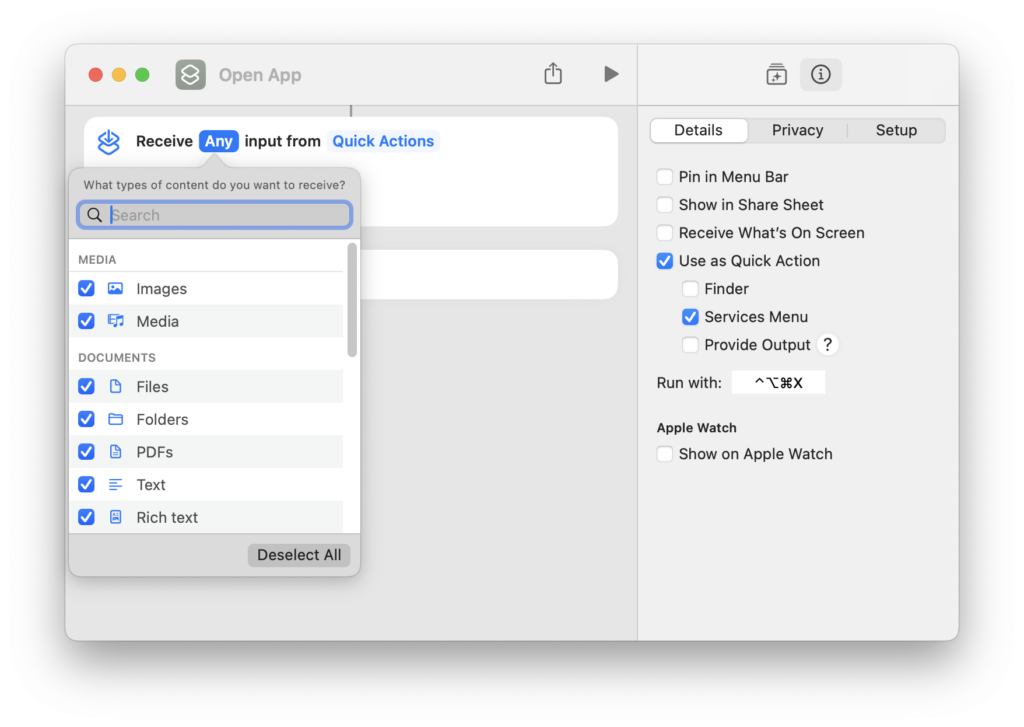
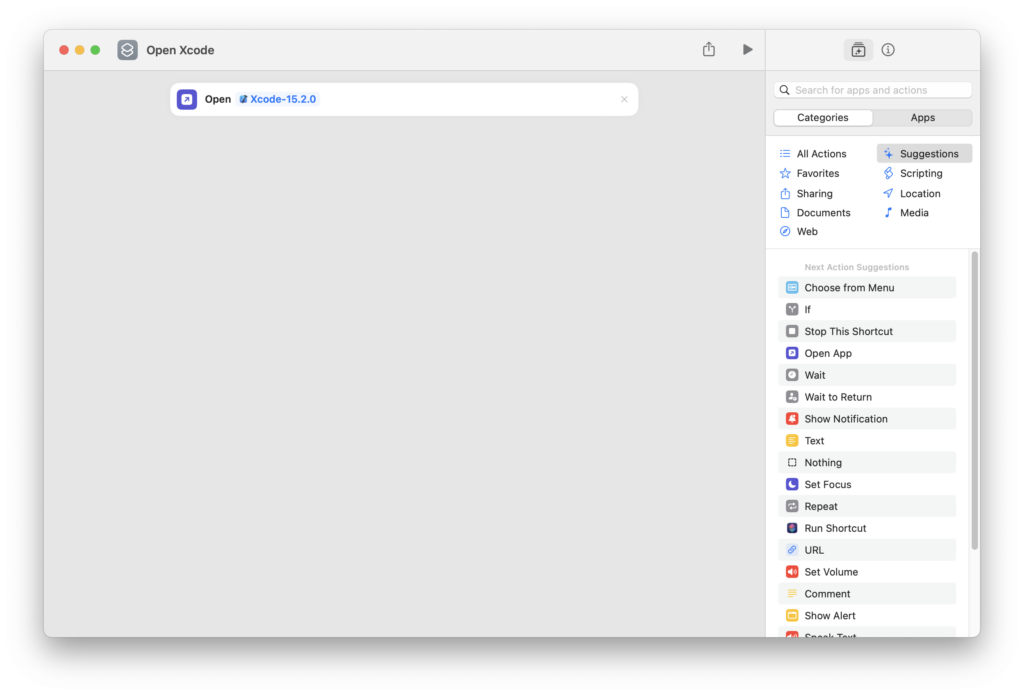
Now you can repeat this process for your most common developer tools like SourceTree, Interactful, Slack, enjoy!
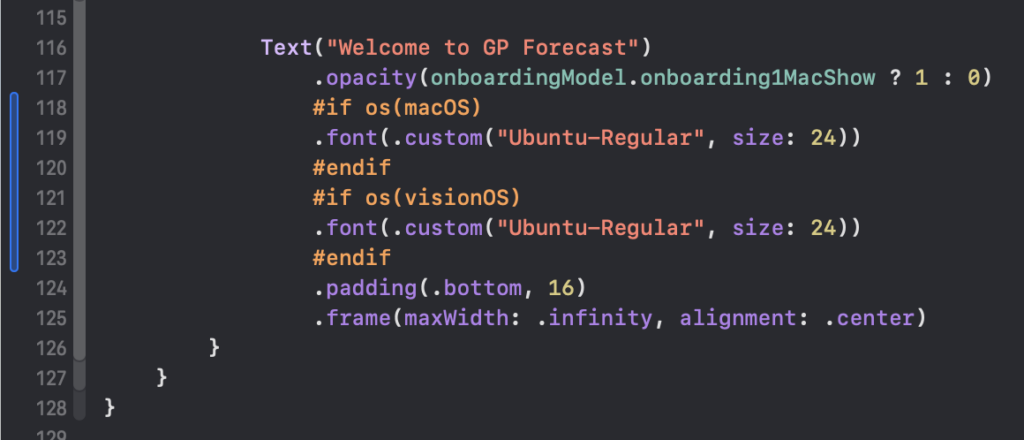
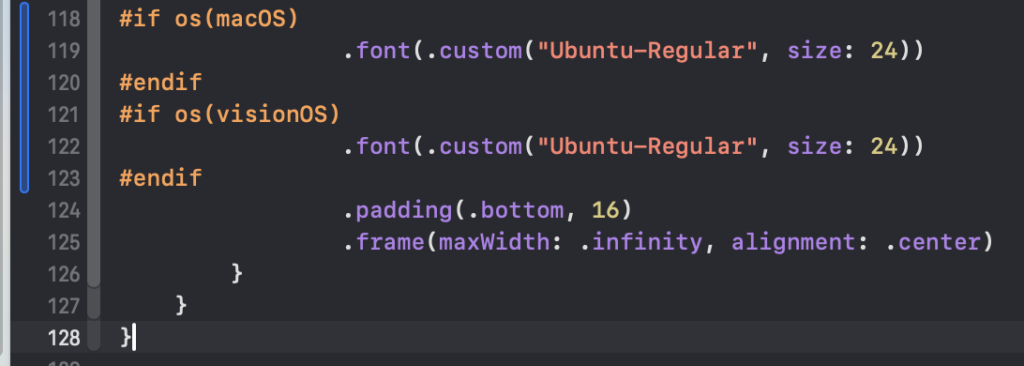
When developing for multiple Apple platforms you can use compiler directives to customize properties for each OS, so you can use one View for multiple platforms. However Xcode aligns them in the code but not at the beginning of each line. There is a simple trick to auto align them all at once in a View by deleting the closing bracket of the View and adding it back.
Before delete:
After delete/adding of last bracket at line 128.
Since iOS 13 [UIView beginAnimation] and [UIView commitAnimations] are deprecated as you can see below.

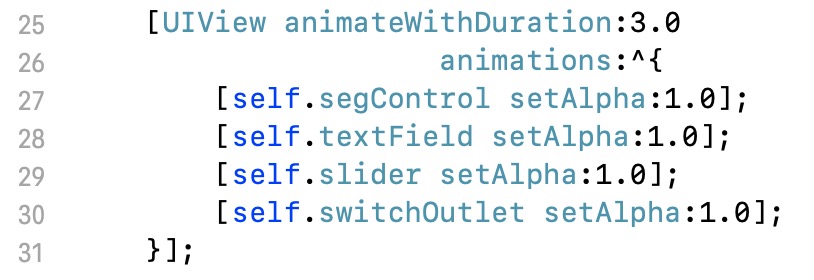
Xcode yells at you that you must use the block-based animation API instead. You should use [UIView animateWithDuration] instead.
This can be achieved like this.
