We’re excited to announce the release of ProShelf version 1.4.5! This crucial update features a complete overhaul to ensure seamless compatibility with macOS Tahoe (version 26 and newer)
Now Free: Intuitive Shelf Nudging
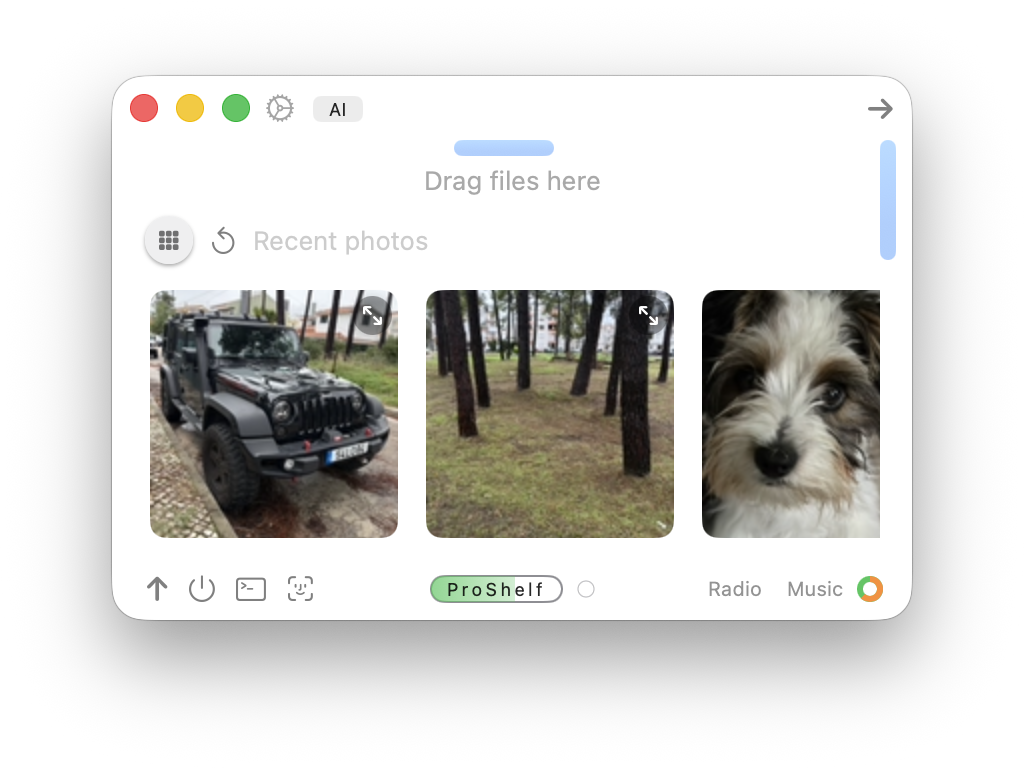
We’ve made a highly requested feature free for all users! The blue touch zones allow you to effortlessly manage your ProShelf’s position. Simply hover your mouse over these zones to gently nudge the shelf in, out of the screen, or snap it back to the top center. Experience enhanced desktop control.
Performance Fix: Lightning-Fast System Stats
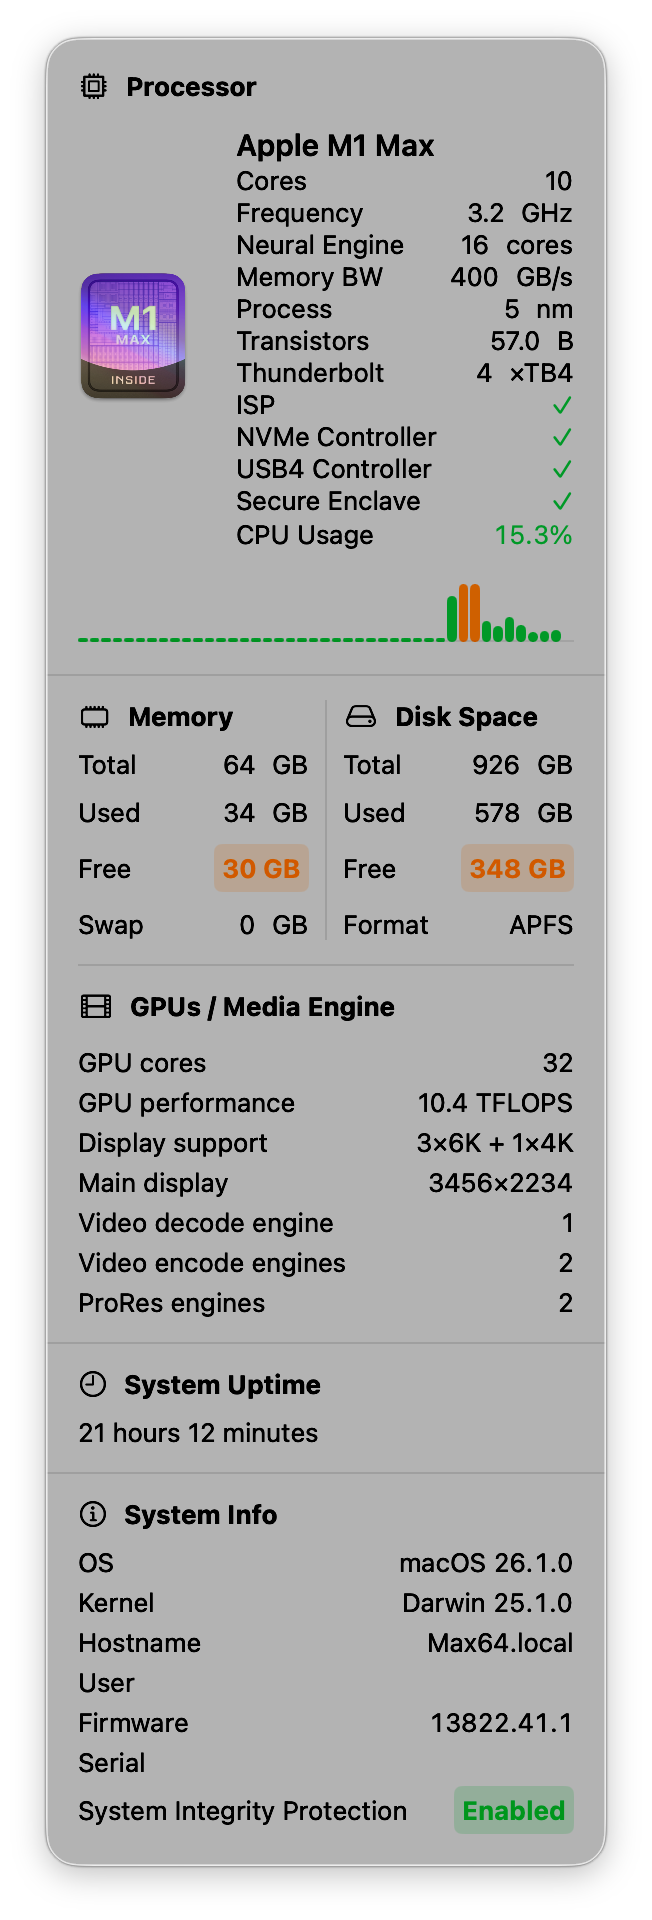
macOS Tahoe introduced an unexpected bug that caused the System Stats View to load slowly. We’re happy to report that this is now completely fixed—the launch is super fast again! The System Stats panel continues to provide detailed metrics, including full support for the latest Apple M5 processor (SoC) series statistics.
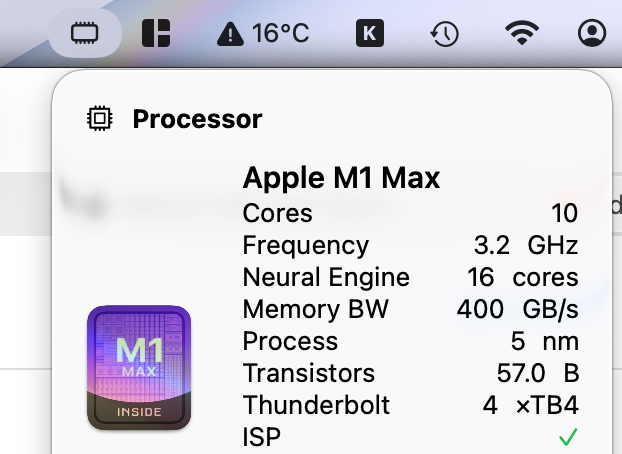
System Stats Menu Bar
As always, you can also access the System Stats directly from your menu bar for quick, at-a-glance monitoring.
Download the update
We’ve poured a lot of work into this release and are confident you’ll love the improved stability and new free feature. Download ProShelf 1.4.5 today and experience the best desktop companion for macOS Tahoe!
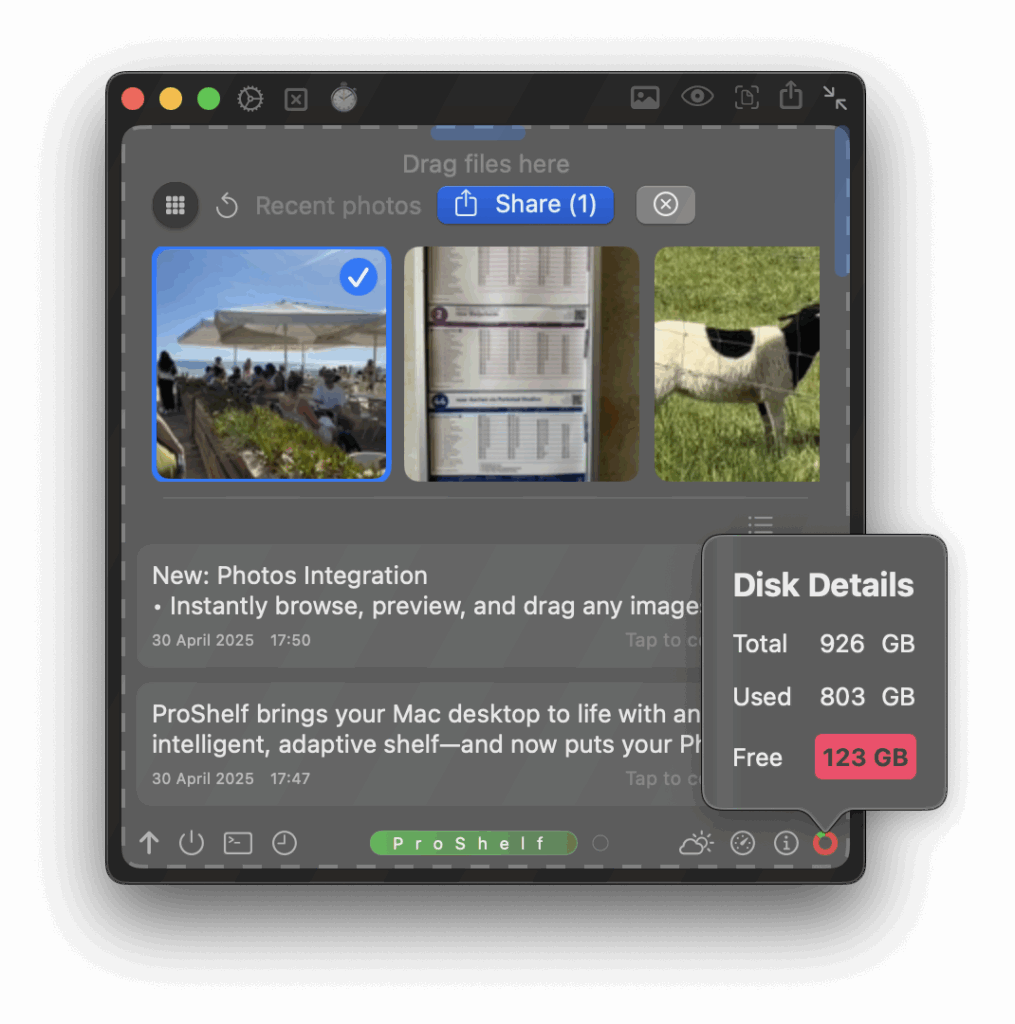
When it comes to organizing digital life, ProShelf is already known for its beautiful blend of AI smarts and Mac-native design. But ProShelf is more than just a file organizer—it’s now also your creative playground, putting real photo editing muscle right inside your shelf. Let’s dive into the powerful new photo editing and effects capabilities, and shine a spotlight on our intuitive side-by-side compare feature.
All-in-One Photo Editing, No Exports Needed
Tired of switching between apps to make simple edits? With ProShelf, you don’t have to. Open any image right in ProShelf, and instantly access a robust set of editing tools that cover everything from basic adjustments to artistic enhancements.
Key Features:
One-Click Filters: Apply stunning looks and quick fixes with our curated set of customizable filters.
Color Adjust & Tints: Fine-tune brightness, contrast, and color, or add a creative flair with tints.
Undo / Redo Everything: Non-destructive edits with a full history make experimentation totally safe.
🎨 14 Professional Filters
Auto Enhance – Intelligent one-click optimization
Vintage Collection – Chrome, Fade, Instant, Transfer effects
Exposure Control – Perfect lighting in any condition
Contrast & Brightness – Fine-tune your image’s mood
Shadows & Brilliance – Professional highlight/shadow recovery
Vibrance & Saturation – Make colors pop naturally
Blur & Sharpen – Creative focus control
🔄 Transform Tools
Rotation – 90° increments with smooth animation
Mirror/Flip – Horizontal flipping for creative compositions
Zoom Control – 0.5x to 4x magnification with precision slider
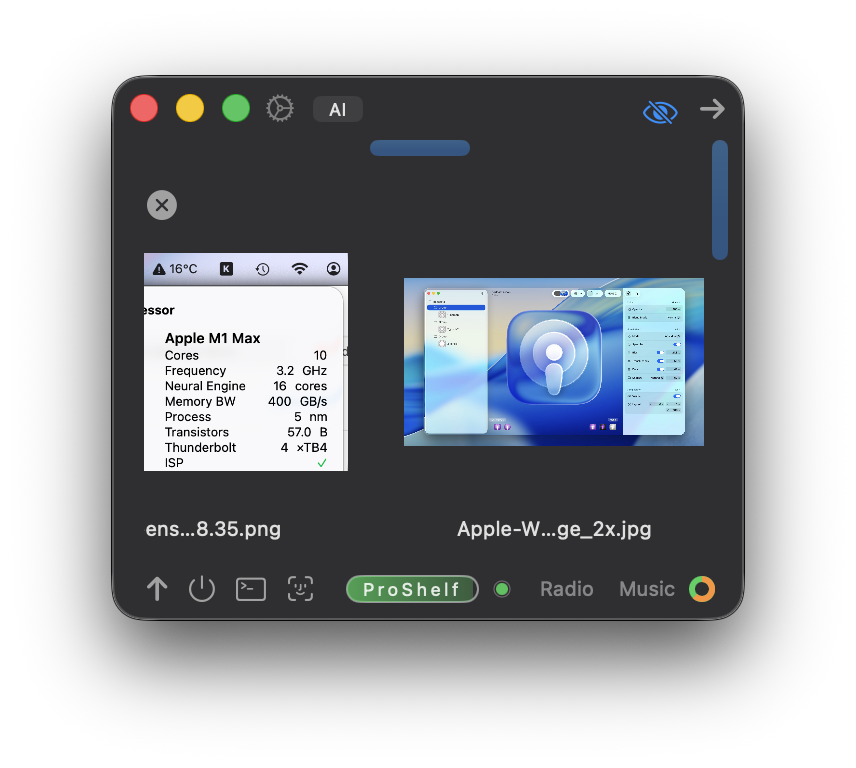
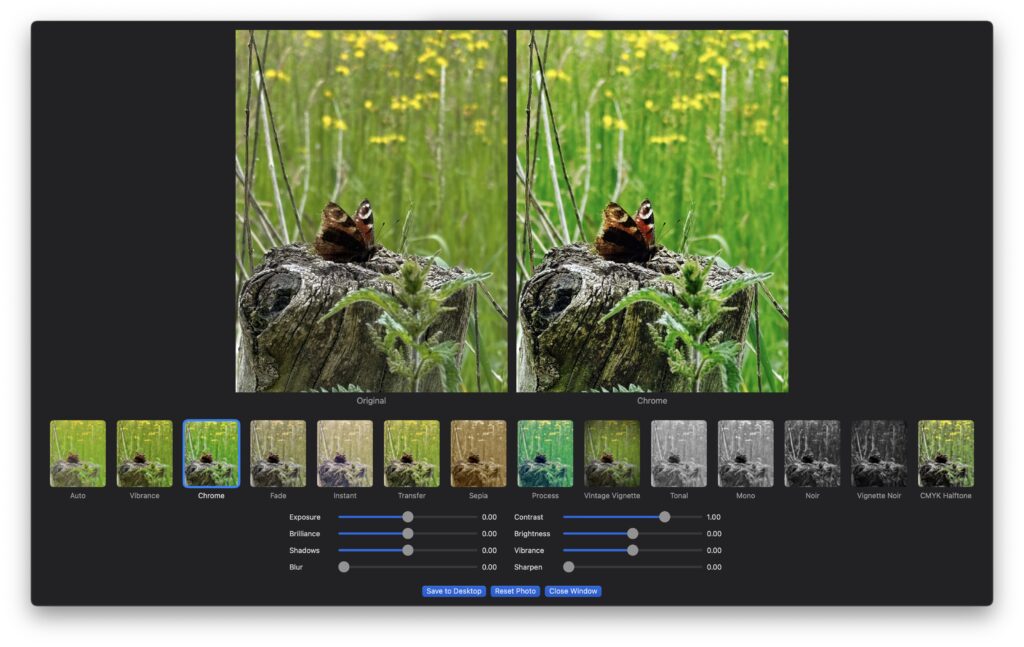
See the Difference: Side-by-Side Compare
One feature users are especially loving is Side-by-Side Compare. We know the uncertainty—sometimes you wonder, “Did my edit really improve the photo?” or “How does the enhanced version stack up against the original?” Now, with a click, you can see the transformation for yourself.
How It Works:
Tap on a filter button or change a effects slider
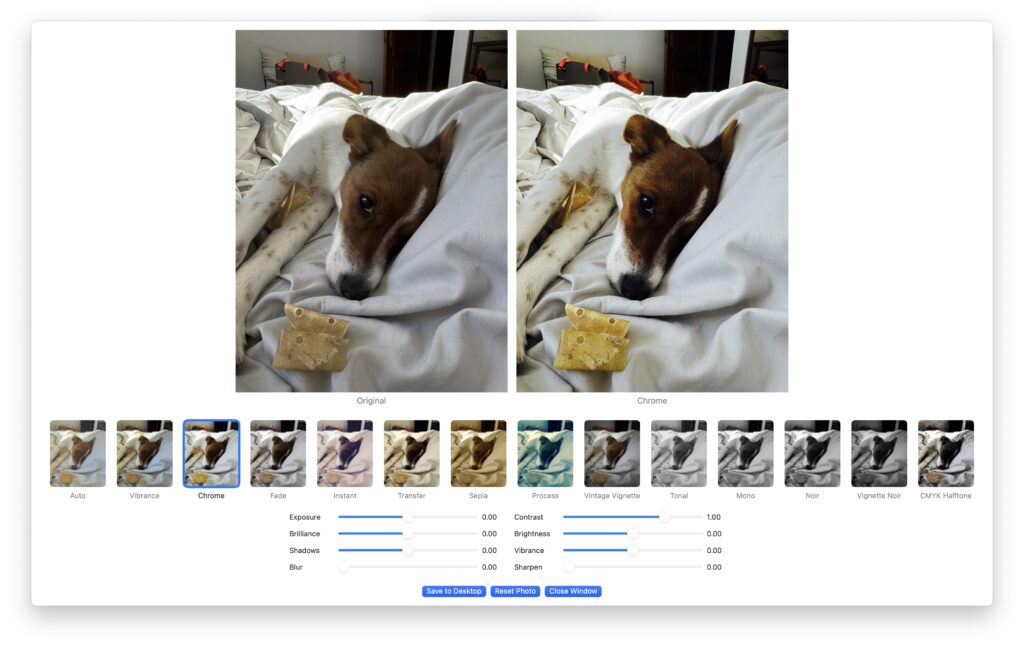
Instantly view your original image and the edited version side-by-side.
Drag a slider (or swap left/right panels) to inspect details up close.
Revert changes if you’re not satisfied—or export/share the improved version with confidence.
This feature isn’t just for perfectionists. It empowers everyone to make informed creative choices, experiment freely, and build trust in their editing workflow. See your improvements in real time, and never worry about “over-editing” or losing your unique vision.
Work Faster, Save Smarter
With ProShelf’s photo tools, you don’t need to juggle photo editors and file managers. Every adjustment is saved right where your photos live.
Ready for a Better Photo Experience?
If you want to edit, and compare photos as naturally as managing files, ProShelf is ready for you. Update today, and experience smart, delightful editing.
I’ve been using Bitbucket for my personal development projects for quite some years now without too many issues. They triggered my interest in the times that GitHub was payable and Bitbucket was providing a free git hosting service, great so far.
Recently one of my git pushed failed because apparently I crossed over the 1 GB hosting limit, a new limit which they decided to apply recently. After some investigations I saw that their website was showing this: Your workspace has exceeded the 1 GB limit and has been placed in read-only mode. Learn more about upgrading your plan and checking storage usage. — Learn more
I actually have around 14 GB of repositories already, and understand that things cost money.
Their new hosting tiers are not very large on storage neither: 5 GB standard edition and 10 GB for the premium edition. So… I went on exploring to self hosting the git repos on my own server, that I already use for backend services of all my (mobile) applications. I host this on Linode with very good experience.
It turned out that this went very smoothly and should have done sooner probably.
Here is what I did — my sever is running Ubuntu Linux by the way.
// update the server packages
sudo apt update

// install git
sudo apt install git

// add the git user
sudo adduser --system --group --disabled-password --home /home/git git

// Set up SSH access:
// Create a .ssh directory for the git user:
sudo su git
mkdir ~/.ssh && chmod 700 ~/.ssh
// Add your public SSH key (content of id_rsa.pub on your Mac ~/.ssh/id_rsa.pub) to the authorized_keys file within the .ssh directory
// Restrict the git user's shell to git-shell:
sudo usermod -s /usr/bin/git-shell git

// create a home directory
sudo mkdir -p /home/git/repos

// change the ownership
sudo chown -R git:git /home/git/repos

// go to the new repos dir
cd /home/git/repos

// initialize a bare repo that you are hosting already on bitbucket
git init --bare todoapp.git

// change the ownership again for the new repo, do this every time you initialize a new bare repo
sudo chown -R git:git /home/git/repos

// now open a terminal session on you local pc and go to the directory of the application already under git control

// example
cd /username/todoapp/

// set the new remote repo location, replace the IP with the address or IP of your server.
git remote set-url origin git@139.122.121.21:/home/git/repos/todoapp.git

// if you get an error here check in /username/todoapp/.git/config what is here: [remote "origin"] sometimes origin is called something else.

// now push any new code changes and it will upload the whole local git repo to the new server. I use SourceTree to push all branches.
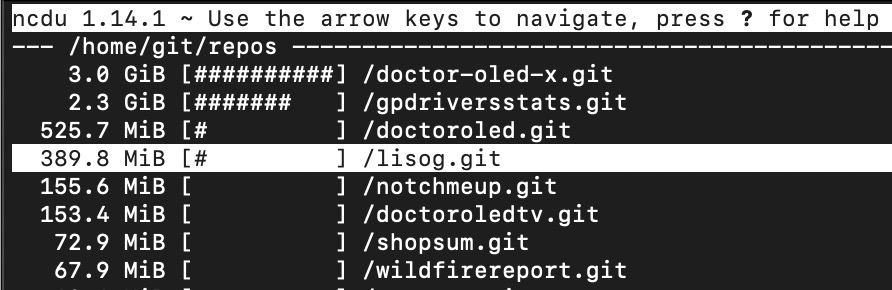
After I’ve done this for all my applications, I went to the server to check the size of the pushed repos, I found that Ubuntu’s free tool ncdu is great for this.
Screenshot
Thanks to Bitbucket for all the years of free hosting ♥️ — and I keep my read-only 14 GB repose there for free as a second cloud backup, you never know.
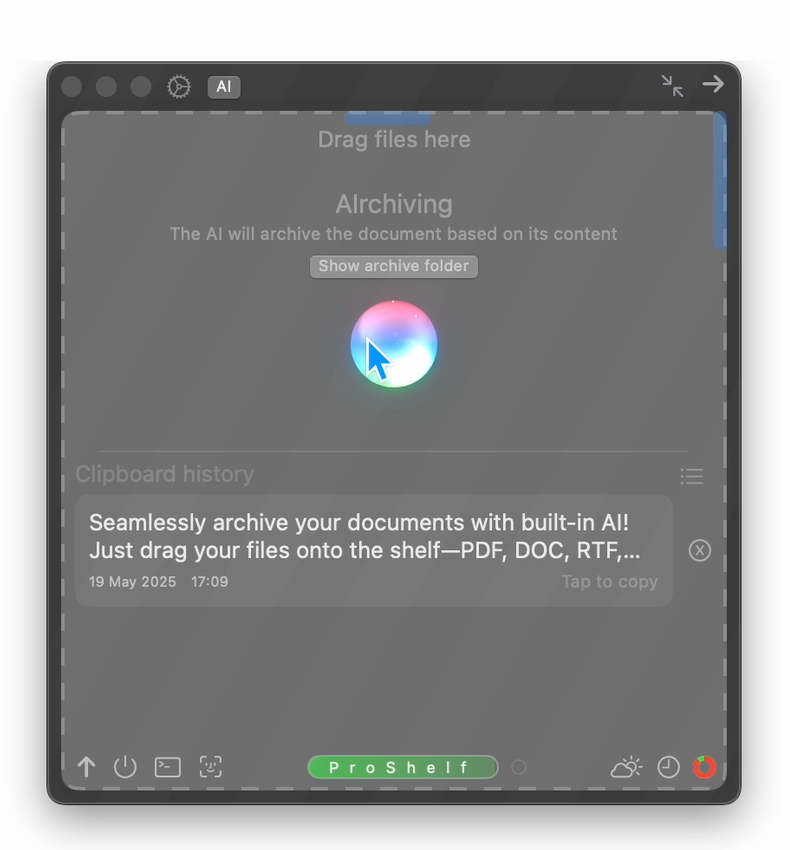
We’re excited to announce an all-new AI Archiving feature in ProShelf, designed to help you effortlessly organize and declutter your digital life. Whether you’re a student, a busy professional, or just someone who collects a lot of files, our new AI Archiving system is here to save you time and hassle.
What Is AIrchiving?
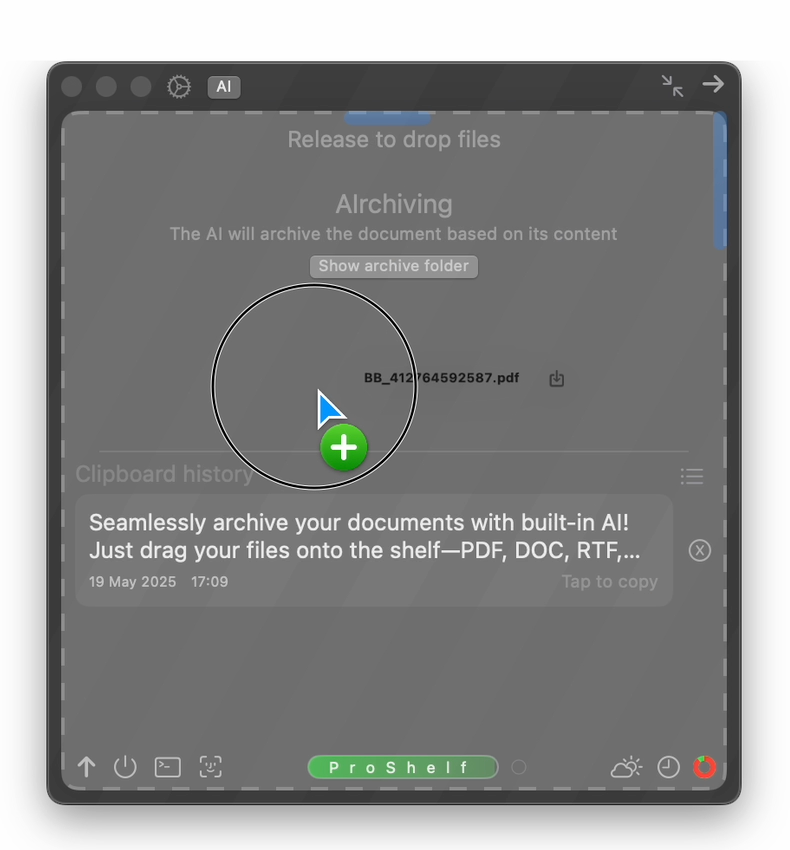
AI Archiving uses machine learning to sort, group, and suggest destinations for your files as they land on the Shelf. Instead of dragging every single document, screenshot, or photo into old folders yourself, ProShelf’s AI analyzes your files and recommends smart filing actions—right at the moment you want them.
Screenshot
How Does It Work?
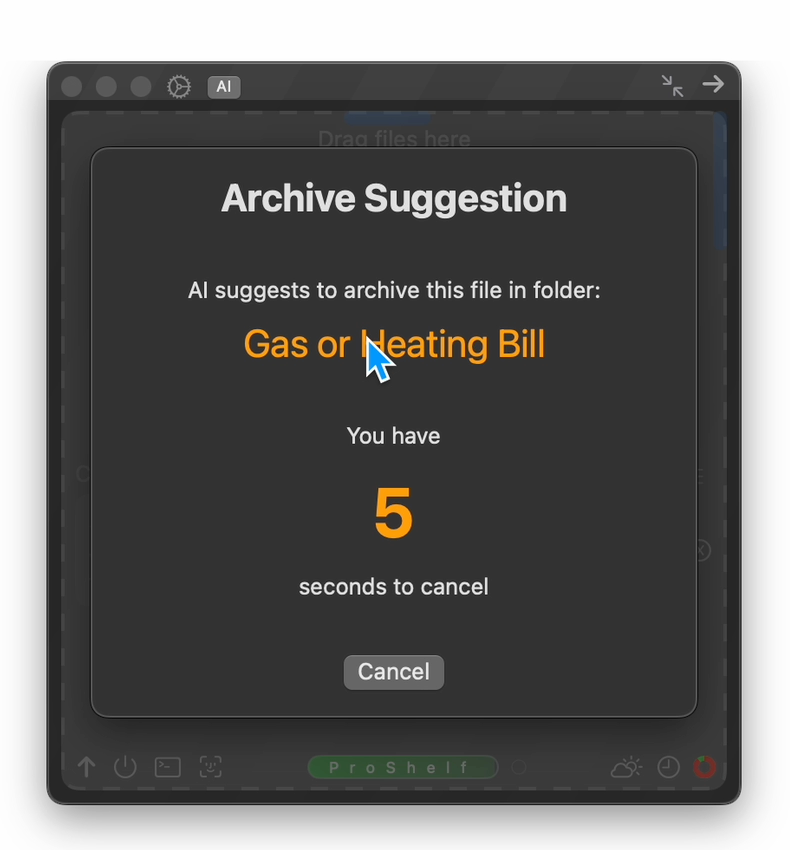
Automatic Sorting: When you add new files to your Shelf, the AI scans the content, type, and even context—like project names or type of purchases. Even photographed receipts are read and processed.
Smart Suggestions: Instantly see archive recommendations, such as “Gas and Heating Bills” or “Employment Contracts,” even if the document are in other languages.
Batch Actions: Select multiple files and let ProShelf’s AI take care of bulk archiving with a single click, always double-checking with you first.
Manual Override: Prefer to keep control? You can always edit suggestions, pick a different archive folder, or skip for now.
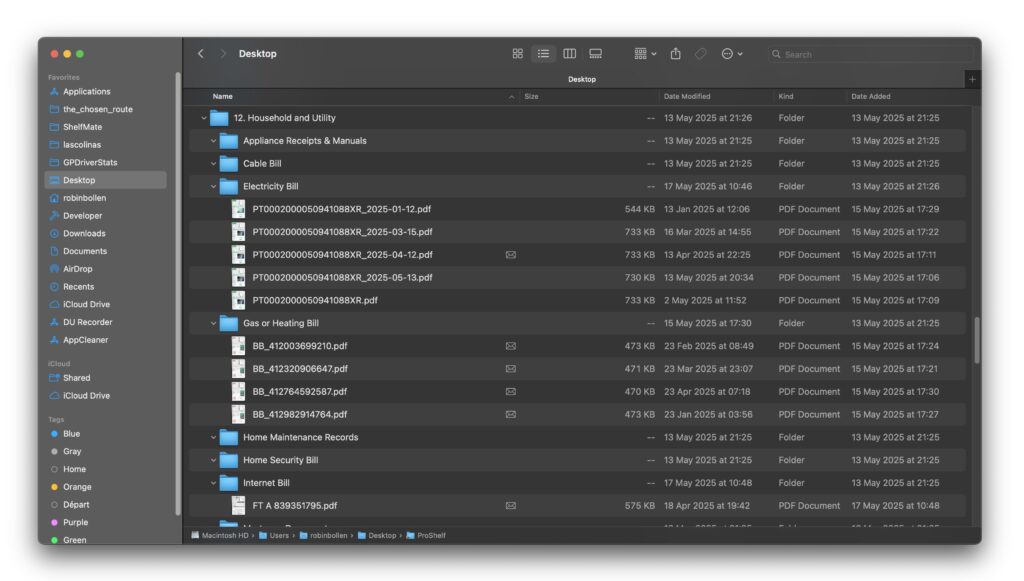
The archive folders live on your desktop in a folder called ProShelf. If you OPTION + Click on the arrow in front to the ProShelf folder it expands all sub folders, so you can see where all your filed documents are
When a new year arrives, you can just drag the whole ProShelf folder out to a new archive location, and tap the recreate folders button to start again fresh.
Why Is This a Game-Changer?
Staying organized is hard work. Our users told us that digital clutter grows fast—and manual cleanup is easy to ignore. We listened! AI Archiving is like having a smart, tireless assistant always on hand, helping you stay productive and zen.
Privacy & Security
All pre-analysis runs entirely on your Mac— your prefilled privacy keywords are masked before sending them to the Cloud. You’re always in control.
Check out the last anonymized text that was sent to the AI so you can build trust in our product.
Screenshot
Try It Out
The AI Archiving feature is available in the latest update to ProShelf. Just look for the new “AI” button on your Shelf header, drop in your usual files, and watch ProShelf put its neural network to work!
We’d love to hear your feedback as you try it—reach out to us any time with suggestions, bug reports, or just to show off your beautifully organized digital shelf.
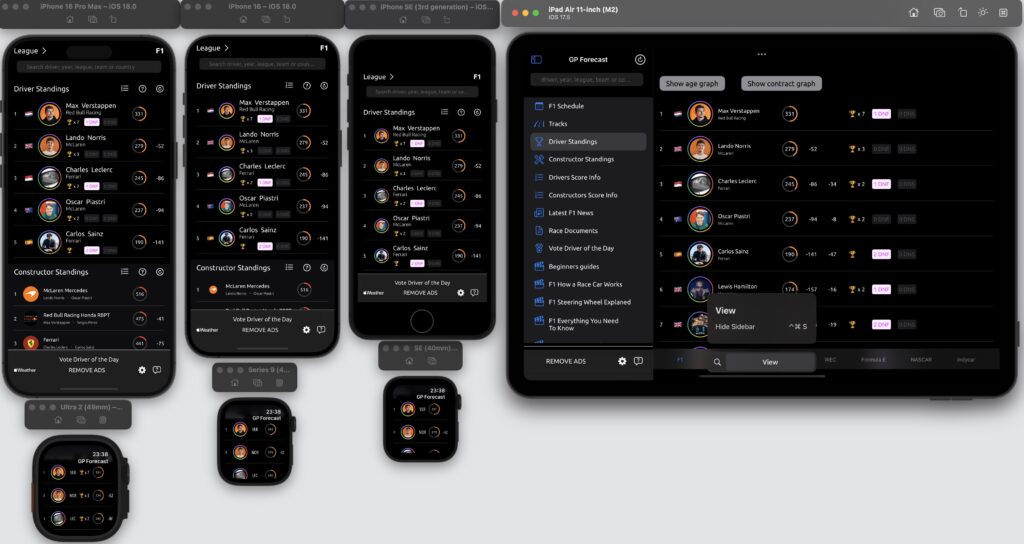
In the ever-evolving world of iOS development, creating adaptive user interfaces is crucial for delivering a seamless experience across various devices and orientations. SwiftUI provides several powerful tools to help developers craft flexible layouts that respond gracefully to different screen sizes and configurations. Let’s explore some key techniques for adaptive design in SwiftUI.
GP Forecast Adaptive Designs
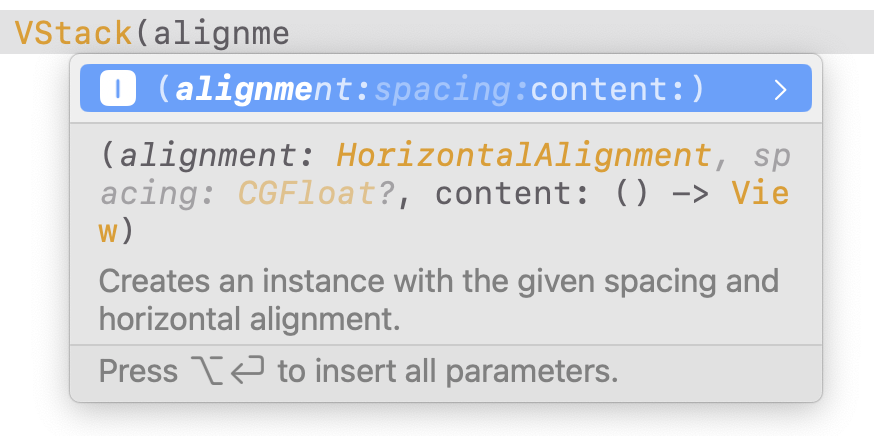
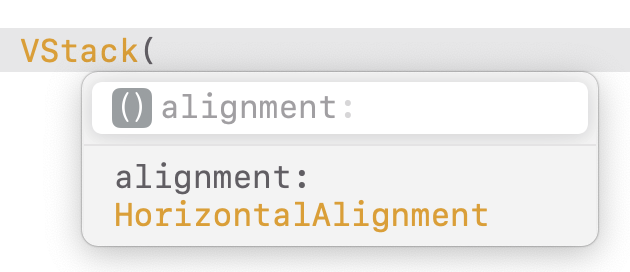
ViewThatFits: Automatic Layout Adaptation
ViewThatFits is a SwiftUI container view that automatically selects the first child view that fits within the available space. This powerful tool simplifies the process of creating adaptive layouts by allowing you to define multiple layout options and letting SwiftUI choose the most appropriate one. Here’s an example of how to use ViewThatFits:
In this example, SwiftUI will display the HStack with both the image and text if there’s enough space. If not, it will fall back to showing just the image.
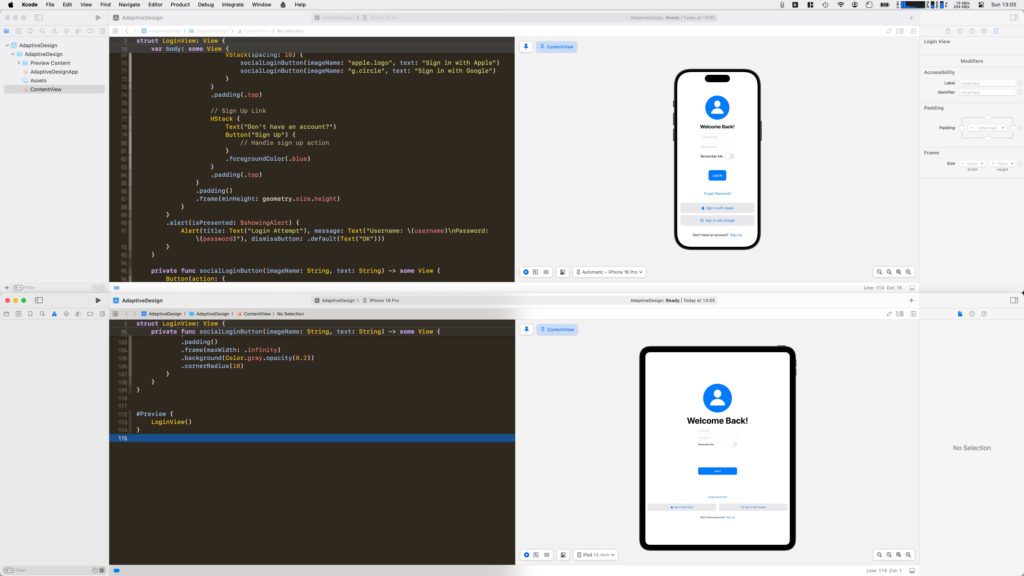
Size Classes: Adapting to Device Characteristics
Size Classes in SwiftUI allow you to adapt your layout based on the available space and device characteristics. By using the @Environment property wrapper, you can access the current horizontal and vertical size classes to make layout decisions. Here’s how you can use size classes to adjust your layout:
@Environment(\.horizontalSizeClass) var horizontalSizeClass

var body: some View {
    Group {
        if horizontalSizeClass == .compact {
            VStack {
                // Compact layout
            }
        } else {
            HStack {
                // Regular layout
            }
        }
    }
}
This approach allows you to create distinct layouts for different device configurations, such as iPhones in portrait mode versus iPads in landscape mode. Here you can find all the size classes for each Apple Device.
GeometryReader: Fine-Grained Layout Control
GeometryReader is a powerful tool that provides detailed information about the size and position of its parent view. This allows for precise control over layout and sizing based on the available space. Here’s an example of using GeometryReader to create a responsive layout:
In this example, the text size and rectangle width are dynamically calculated based on the available width, ensuring the layout remains proportional across different screen sizes.
UIScreen.main.bounds.width: A Practice to Avoid
While it might be tempting to use UIScreen.main.bounds.width for layout calculations, this approach is considered bad practice in SwiftUI. It doesn’t account for factors like Split View on iPad, rotation changes, or future device form factors. Instead of relying on UIScreen.main.bounds.width, it’s better to use SwiftUI’s built-in layout system, including GeometryReader, size classes, and flexible spacing. These tools provide a more robust and future-proof way to create adaptive layouts.
Conclusion
Adaptive design in SwiftUI is about creating flexible, responsive layouts that work well across all iOS devices. By leveraging tools like ViewThatFits, size classes, and GeometryReader, you can create UIs that automatically adjust to different screen sizes and orientations. Remember to avoid hard-coding dimensions or relying on specific device characteristics, and instead embrace SwiftUI’s powerful layout system for truly adaptive designs.
When developing applications, encountering crashes is an inevitable part of the process. However, analyzing crash logs can provide invaluable insights into what went wrong, helping developers fix bugs and improve app stability. This blog post will explore how to access crash logs in Xcode and the process of symbolication, which transforms unreadable crash reports into meaningful information.
Accessing Crash Logs in Xcode
Crash logs are automatically generated when an app crashes on a user’s device. If users have opted to share crash data, these logs can be accessed through Xcode. Here’s how you can find and review these logs:
Open Xcode: Launch the application on your Mac.
Navigate to Organizer: From the menu bar, select Window > Organizer.
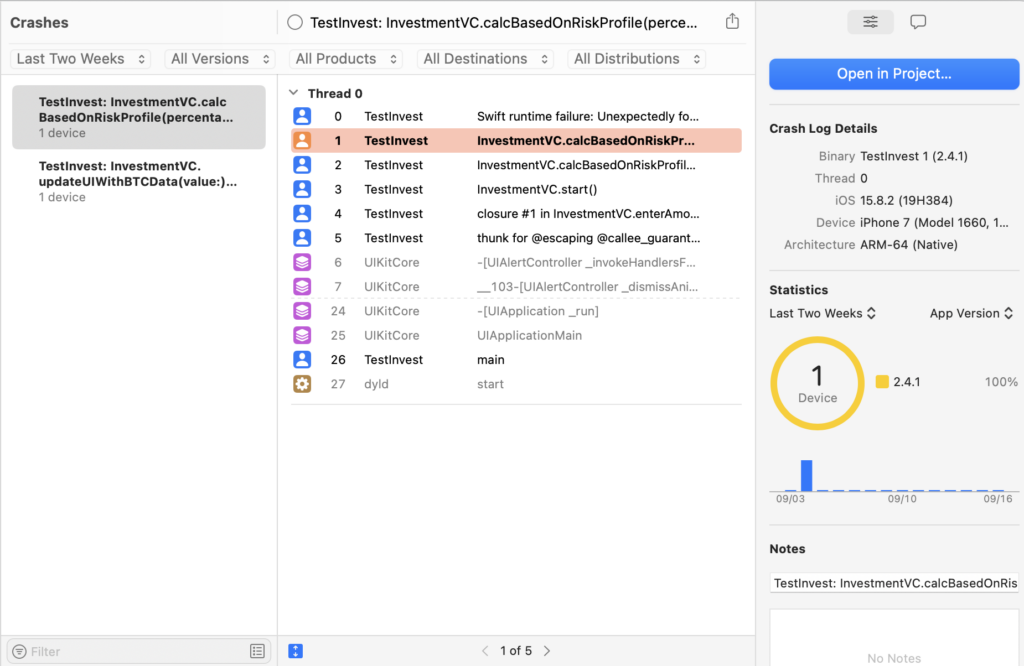
Select Crashes: In the Organizer window, click on the Crashes tab. Here, you can view crash reports from your app’s builds distributed via TestFlight or the App Store.
View Individual Reports: You can control-click on a specific crash report to open it in Finder for a more detailed examination.
Analyze Statistics: The Organizer provides at-a-glance statistics about crashes, such as the percentage of users experiencing issues across different iOS versions and devices.
For more granular analysis, you can export crash reports directly from devices or through the Console app for Mac applications. This allows you to troubleshoot individual incidents that may not be reflected in aggregated data.
Understanding Crash Logs
A typical crash log contains several key pieces of information:
Exception Type: Indicates what kind of error occurred (e.g., SIGABRT).
Termination Reason: Provides additional context on why the app terminated.
Backtrace: A list of function calls leading up to the crash, showing where in your code the issue occurred.
However, these logs are often presented in a raw format that includes memory addresses instead of function names, making them difficult to interpret without additional processing.
The Process of Symbolication
Symbolication is the process of converting these raw memory addresses into human-readable function names, file names, and line numbers. This is crucial for diagnosing crashes effectively.
Ensure dSYM Files are Available: When you build your app for distribution (e.g., via TestFlight or App Store), ensure that you include dSYM files. These files contain debug symbols necessary for symbolication.
Use Xcode’s Symbolication Tools:
Open Xcode and navigate to the Crashes section in the Organizer.
Select a crash report to view its details.
If your dSYM files are correctly linked, Xcode will automatically symbolicate the crash log, allowing you to see exactly where in your code the crash occurred.
Manual Symbolication: If you have a raw crash log file (e.g., .ips or .xccrashpoint), you can manually symbolicate it using Terminal commands or third-party tools like atos. For example:
atos -o /path/to/your/app.dSYM/Contents/Resources/DWARF/YourApp -arch arm64 -l <load_address> <address>

Replace <load_address> and <address> with values from your crash log.
Best Practices for Handling Crash Logs
Prioritize Crashes: Not all crashes affect users equally; prioritize fixing issues that impact a larger user base.
Integrate Analytics Tools: Consider using third-party tools that provide enhanced analytics and visualization for crash reports.
Regularly Review Logs: Make it a habit to review crash logs after each release or major update to catch any new issues early.
Conclusion
Understanding and managing crash logs is a vital skill for any iOS developer. By effectively accessing and symbolizing these logs in Xcode, developers can gain critical insights into their applications’ performance and stability. This not only helps in resolving issues but also enhances user experience by ensuring that apps run smoothly. With regular practice and familiarity with these tools, developers can significantly improve their debugging processes and overall application quality.
In the world of iOS and macOS development, Xcode is the powerhouse tool that developers rely on daily. While Xcode is packed with features, mastering its keyboard shortcuts can significantly boost your productivity. Here’s a comprehensive guide to some of the best Xcode shortcuts, along with a nifty trick on how to customize them to fit your workflow.
Essential Xcode Shortcuts Navigation: Cmd + Shift + O: Open Quickly – This is your go-to for opening any file in your project instantly. Cmd + 0: Show/Hide the Navigator – Toggle the left sidebar on and off. Cmd + 1 to Cmd + 9: Switch between different Navigator sections (Project, Source Control, Debug, etc.).
Editing: Cmd + /: Comment/Uncomment the selected line or block of code. Cmd + D: Duplicate the current line or selection. Control + /: Indent or un-indent the current line or selection. Option + Delete: Delete the word to the left of the cursor.
Code Completion and Navigation: Esc: Complete the current word or show code completion suggestions. Cmd + Click: Jump to the definition of a symbol or open the Quick Help for it. Control + 6: Jump to the previous issue or warning in the Issue Navigator.
Debugging: Cmd + Y: Show or hide the Debug Area. Cmd + Shift + Y: Show or hide the Debug Area and the Navigator at the same time. Cmd + Option + I: Show the Debug Navigator.
Customizing Your Shortcuts One of the lesser-known features of Xcode is its ability to customize keyboard shortcuts. This can be particularly useful if you find yourself frequently performing a specific action or if you’re switching from another IDE with different shortcuts.
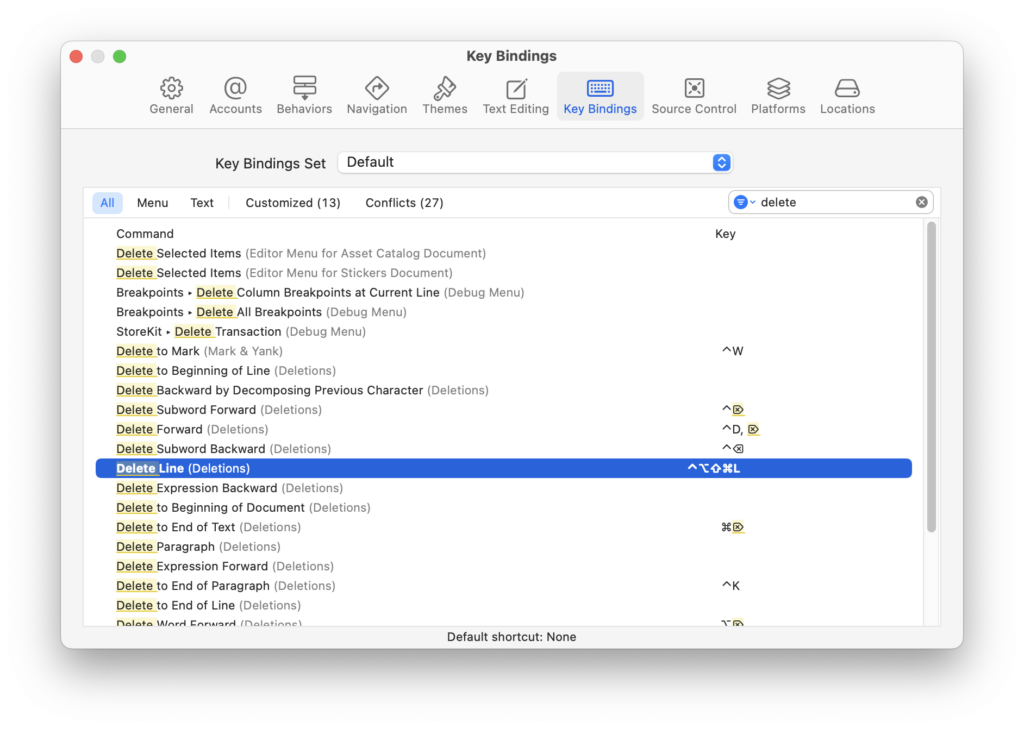
How to Create Custom Shortcuts: Open Preferences: Go to Xcode > Preferences > Key Bindings. Find Your Command: Use the search bar at the top to find the command you want to customize. For instance, if you want to delete the current line, you might search for “Delete to End of Line” or “Delete Line”. Assign a New Shortcut: Click in the field next to the command and press your desired key combination. For example, Shift + Control + Option + Command + L could be set to delete the current line, as you’ve done.
Tips for Customization: Avoid Conflicts: Make sure your custom shortcut doesn’t conflict with existing Xcode or system shortcuts. Consistency: Try to keep your shortcuts consistent with other tools you use to avoid confusion. Document Your Changes: Keep a note of your custom shortcuts, especially if they’re complex, to save time in remembering them.
Conclusion Mastering Xcode’s keyboard shortcuts is like learning a new language that speaks directly to your productivity. By integrating these shortcuts into your daily workflow, you’ll find that tasks that once took several clicks now take just a moment. And by customizing your shortcuts, you tailor Xcode to your unique coding style, making your development environment not just a tool, but an extension of your thought process. Whether you’re a seasoned developer or just starting out, these shortcuts will help you code smarter, not harder. Happy Xcoding!
Mastering Xcode Debugging with LLDB: A Step-by-Step Guide to Changing Variables at Breakpoints
In the realm of iOS and macOS development, Xcode stands as the primary Integrated Development Environment (IDE), offering powerful tools for developers, including the LLDB debugger. LLDB, or LLVM Debugger, is a powerful successor to GDB, providing advanced debugging capabilities right within Xcode. One of the lesser-known but incredibly useful features of LLDB is the ability to modify variable values directly during a debugging session. Here’s a comprehensive guide on how to leverage this feature to enhance your debugging workflow.
Understanding LLDB in Xcode
LLDB is more than just a debugger; it’s an interactive environment where you can inspect and manipulate your program’s state. When your app hits a breakpoint, you’re not just pausing execution; you’re entering a session where you can query, modify, and even execute code within the context of your app’s current state.
Setting Up Your Debugging Session
Open Your Project in Xcode: Launch Xcode and open your project.
Set a Breakpoint: Navigate to the line of code where you want to pause execution. Click in the gutter to the left of the line number to set a breakpoint.
Run Your App in Debug Mode: Click the run button or use the shortcut (Cmd + R). Your app will run until it hits the breakpoint.
Modifying Variables with LLDB
Once your app hits the breakpoint, follow these steps:
Open the Debugger Console: At the bottom of Xcode, there’s a console area. If it’s not visible, go to View > Debug Area > Activate Console or use the shortcut (Cmd + Shift + Y).
Inspect Variables: You can see local variables in the debugger sidebar. Alternatively, type frame variable in the console to list variables in the current scope.
Change a Variable’s Value:
Direct Assignment: If you want to change a variable named myVariable to 10, simply type: expr myVariable = 10
Using Expressions: You can also use more complex expressions. For instance, to increment a counter: expr counter++
Confirm Changes: After modifying a variable, you can check its new value by typing frame variable again or by hovering over the variable in your code if you’ve enabled variable watching.
Practical Example
Imagine you’re debugging a function that calculates the factorial of a number, and you want to see how changing the input affects the result:
func factorial(_ n: Int) -> Int {
    if n <= 1 {
        return 1
    } else {
        return n * factorial(n - 1)
    }
}
Set a breakpoint inside the factorial function.
Run your app to hit the breakpoint.
Change the value of n:
expr n = 5
Continue execution (Cmd + Option + Y) to see how this change affects the function’s output.
Tips for Effective Debugging with LLDB
Use help in the console to discover more commands.
Watch Expressions: You can add expressions to watch in the debugger sidebar, which updates dynamically as you modify values.
Breakpoints with Conditions: Set breakpoints that only trigger when certain conditions are met, reducing unnecessary pauses.
Conclusion
Mastering LLDB within Xcode can significantly boost your productivity as a developer. The ability to alter variable values at runtime not only aids in debugging but also in understanding the flow and impact of your code in real-time. This technique is particularly useful for experimenting with different scenarios without needing to recompile or rerun your application. Remember, effective debugging is about exploring, understanding, and sometimes, creatively manipulating your code’s environment to uncover issues or test hypotheses. Happy debugging!